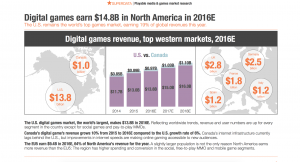
The $14.8B North America digital games market is one of the largest and most complex in the world. Most publishers are familiar with digital gamers in the U.S. and Canada, but many do not realize how quickly this market is changing. In order to take advantage of this region—which boasts one of the highest lifetime value (LTV) rates in the world at $221—stakeholders need to be keenly aware of what drives these gamers, and how the shifting sands of their preferences will impact the potential of each segment of digital games.
This report details the full spectrum of digital games (free-to-play MMO, P2P MMO, social, mobile, digital console and PC) in North America, and dives into the differences between Canadian and American gamers, from payment preferences to spending behavior, demographics and more. Armed with these vital data, readers are prepared to optimize their endeavors in the largest digital PC market, make informed decisions about a maturing free-to-play MMO sector, and prepare for a fast-growing digital console territory.
1 OVERVIEW
Index
Methodology
MARKET OVERVIEW
Western Digital Games Market……………………………………………..6
- North America and EU5 Digital Games Revenues ($, billion) — 2016E North America Digital Games Revenues ($, billion)— 2014-2018E
- Game Platform Breakdown…………………………………………………..7
- North America Digital Games Revenue ($, million) and Market Share (%) by Category — 2016E
- North America Digital Games Revenue Growth (%) by Category— 2015-2016E
- Payment Methods………………………………………………………………. 8
- North American Digital Games Payment Methods Market Share (%) by Country — 2015
- U.S. Payment Brands Market Share (%) — 2015
SOCIAL GAMES MARKET
- Social Games Revenue and Metrics……………………………… 10-12
- Worldwide Social Games Revenue ($, billion) — 2014-2018E
- North America Social Games Revenue ($, million) and Monthly Active Users (million) — 2014-2018E
- North America Social Games Conversion (%) and ARPPU ($) — January 2015 – December 2015
MOBILE GAMES MARKET
- Mobile Games Revenue and Metrics………………………………14-16
- Worldwide Mobile Games Revenue ($, billion) — 2014-2018E
- North America Mobile Games Revenue ($, million) and Monthly Active Users (million) — 2014-2018E
- North America Mobile Games Conversion (%) and ARPPU ($) — January 2015 – December 2015
FREE-TO-PLAY MMO GAMES MARKET
- Free-to-Play MMO Revenue and Metrics………………………..18-20
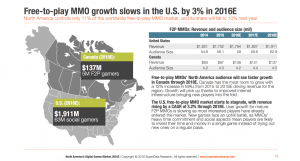
- Worldwide F2P MMO Revenue ($, billion) — 2014-2018E
- North America F2P MMO Revenue ($, million) and Monthly Active Users (million) — 2014-2018E
- North America F2P MMO Conversion (%) and ARPPU ($) — January 2015 – December 2015
DIGITAL PC GAMES MARKET
- Digital PC Revenue and Metrics……………………………………..22-24
- Worldwide Digital PC Revenue ($, billion) — 2014-2018E
- North America Digital PC Revenue ($, million) and Monthly Active Users (million) — 2014-2018E
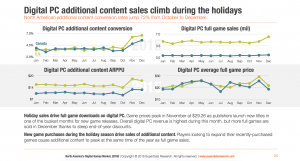
- North America Digital PC Additional Content Conversion (%) and ARPPU ($) — January 2015 – December 2015
- North America Digital PC Full Game Sales (million) and Average Price ($) — January 2015 – December 2015
DIGITAL CONSOLE GAMES MARKET
- Digital Console Revenue and Metrics…………………………….. 26-28
- Worldwide Digital Console Revenues ($, billion) — 2014-2018E
- North America Digital Console Revenue ($, million) and Monthly Active Users (million) — 2014-2018E
- North America Digital Console Additional Content Conversion (%) andARPPU ($) — January 2015 – December 2015
- North America Digital Console Full Game Sales (million) and Average Price ($) — January 2015 – December 2015
DEFINITIONS
- Game Platforms & Categories…………………………………………… 30
- Devices…………………………………………………………………………… 31
- Terminology……………………………………………………………….. 32-34
- Geographies……………………………………………………………………. 35
EVERYTHING ELSE
- Methodology…………………………………………………………………… 37
- Company Summary…………………………………………………………. 38
- Market Data……………………………………………………………………. 39
- Contact…………………………………………………………………………… 40